Know what to fix first, in dollars.
ProfitRoot checks your Shopify orders, ranks the problems by dollars, and shows the evidence and the rule behind each one.
of Net Sales on the sample store, matched to Shopify to the cent. The 14 orders held out each carry a reason.
ran on the sample store's December. Every item names the rule that raised it.
got no dollar figure: they cannot be sized without a missing source, so they are not guessed.
Sample store on the public demo, 1-27 Dec 2025.
It opens on one sentence.
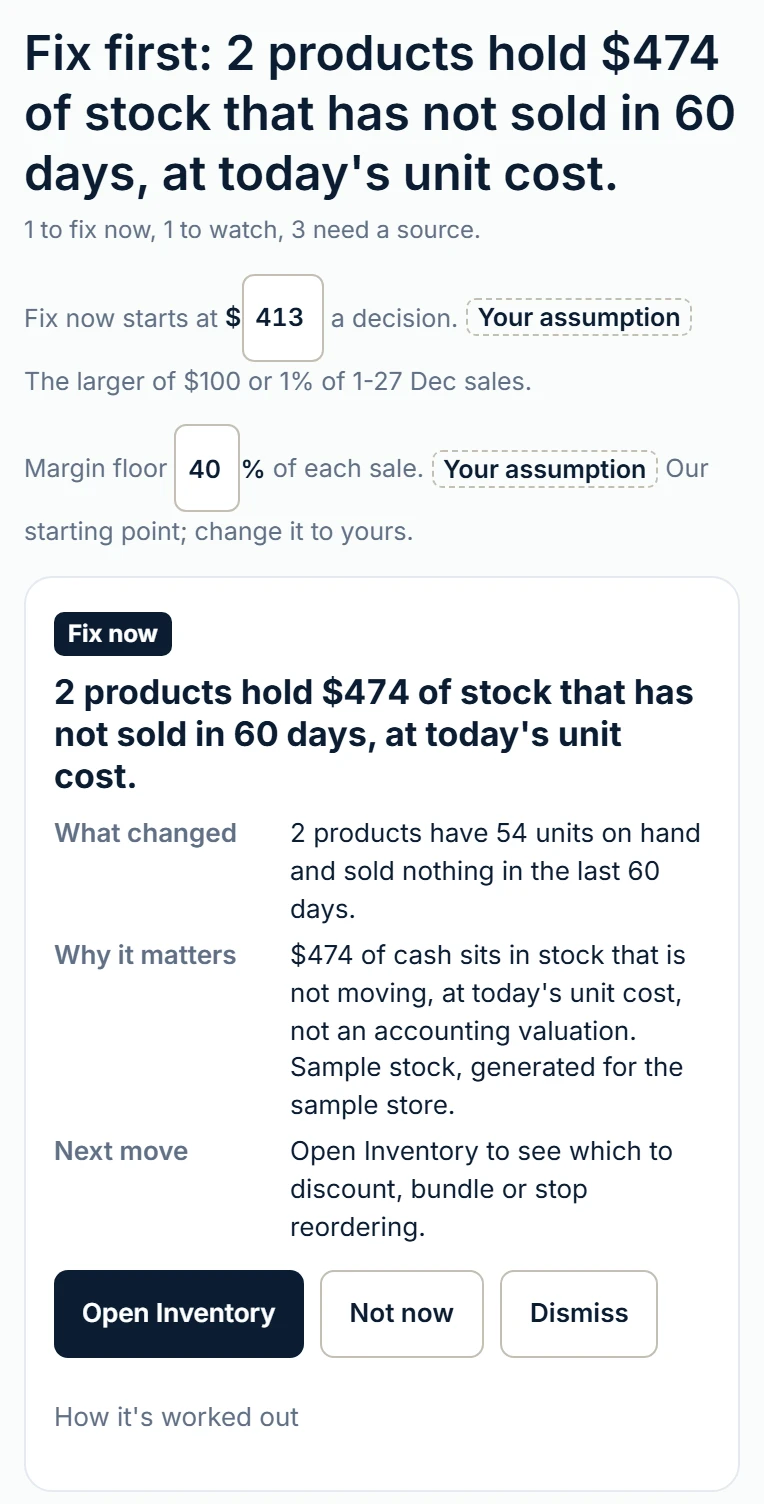
The problem worth your time first, with its dollar size, or a plain statement that nothing needs fixing. On the public demo it reads:
Fix first: 2 products hold $474 of stock that has not sold in 60 days, at today's unit cost.
Under it: what changed (2 products have 54 units on hand and sold nothing in the last 60 days), why it matters ($474 of cash sits in stock that is not moving, at today's unit cost), the one next move, and the rule that raised it, dead-stock v1. The sample stock is generated for the sample store. Nothing changes until you decide.
Three things it does that a profit dashboard does not.
Every item names the check that found it. 10 rules ran on the demo: 1 says fix now, 1 says watch, 3 say what source they need, and 5 found nothing to do (refunds took 4.1% of gross sales against 4.5% in an average month; 0 of 13 products fell below the margin floor).
A problem it cannot size gets no dollar figure. On the demo, ad cost per order says “No dollar shown: we do not guess a normal month”, because 1 month of Meta spend is on file and a baseline needs 3. It asks for the missing months instead.
Net Sales matches Shopify to the cent: $41,304.04 across 271 orders on the demo. The 14 orders held out are each named with a reason: 7 pending ($1,132, which may still arrive), 5 voided and 2 test.
Then it plans with you.
“Net sales finished 6% behind plan, 1-27 Dec”: $41,304 of $43,978 planned, and which part of the gap came from where.
Money in and out by week for 13 weeks. No bank balance is read, so it is never shown as cash on hand. On the demo: “Lowest week: 12-18 Jan, $5,377 more out than in.”
What a 1% move in prices, orders, product costs, ad spend or returns would have been worth, from your own costs, with what each row holds stated as your assumption. On the demo: “A 1% price rise would have added about $400 in 1-27 Dec, units held the same.”
An expectation for next month, tested on your own past months, printed with its own error. On the demo it is last month repeated, “typically off by 19.2% across the 13 months it was tested on”.
What a dashboard does better.
If you want every metric on one screen, a dashboard shows more at once. It updates through the day and credits sales to ad channels. ProfitRoot syncs nightly and credits nothing to a channel, so if the question is this afternoon’s ad spend, a dashboard is the right tool.
Ranks what to fix first by dollars, and ties Net Sales to Shopify to the cent.
Install free from the Shopify App StoreOrders synced from a connected Shopify store are transmitted to and stored on our servers so they can be recomputed on later visits.
Every figure on this page is from the public demo, which runs on a sample store (1-27 Dec 2025), read on 9 Nov 2026.